Doing Business In India
World Bank has come out with ‘ease of doing business’ ranking for countries. Unfortunately India ranks 122 out of 181 countries. Major competitors of India as outsourcing hub, Malaysia, Srilanka or China rank higher than it.
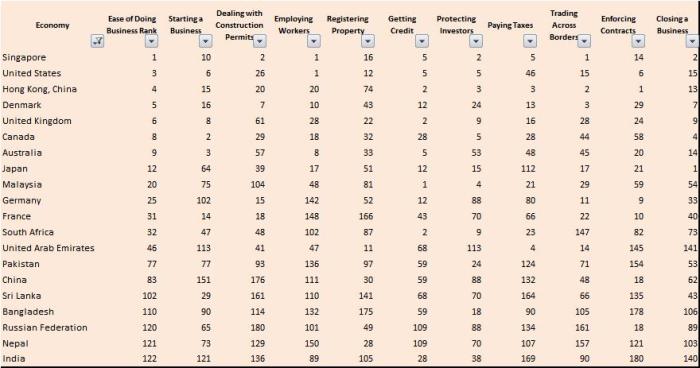
The full ranking can be seen here.
They have come up with ranking of cities within India also. Good to know that Ranchi ranks higher than even Mumbai, Bangalore.
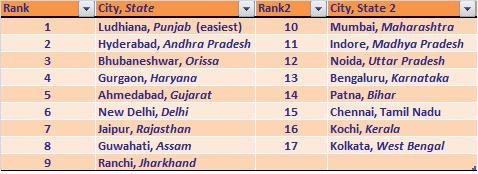
The matrix cities have been compared on are: starting a business, dealing with construction permit, registering property, enforcing contracts, trading across borders, paying taxes, closing a business.
To have better insight into ranking, you can go through the full report here. But it’s heartning to know that despite of naxalite problem, government unwillingness, local work culture Ranchi ranks higher than Mumbai and Bangalore, India’s business capital.
Australia’s Bowling Worries
Look at below chart, plotting three important bowling performance matrix for all major cricket playing nations from year 2002 to year 2008. It’s surprising to know that Australia has the worst economy rate , the worst bowling average, and the worst strike rate. Yes, I know , you must be thinking about the great Mcgrath and the great and entertaining Warne. While Mcgrath retired in year 2007 with career statistics: Average,22.02,Strike rate,34,Economy rate,3.88; Warne retired in year 2005 with career figure of Average,25.73,Strike rate,36.3,Economy rate,4.25.
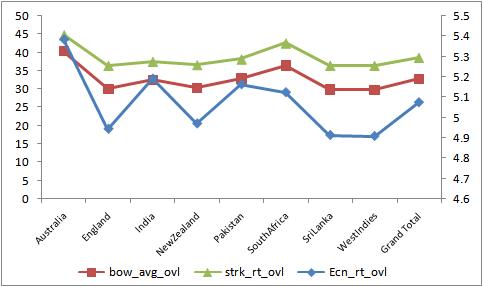
Please note that economy rate is plotted against secondry axis.
The possible explanation could be that, may be they score high, and so does the opposition; or may be all teams raise their level high against Aussies, and lower down their standard against other teams.
To test this hypothesis, let’s see how do rest of the countries fare against Aussies in these three measures.
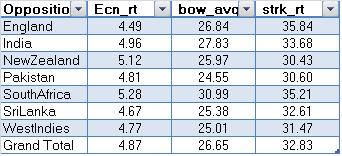
Let’s see how Australia’s bowler has done compared to their counterparts.
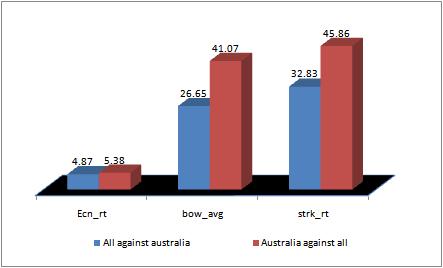
It seems, we have no choice but to reject the earlier hypothesis. Moreover, looking at the above bar chart, one is tempted to conclude that Aussies must have lost more mathes than they would have won in this time period.
Interaction Variable
Suppose in a laboratory experiment, we are trying to figure out sweetness of tea as a function of variable ‘quantity of sugar’ and ‘frequency of stirring’ . With full day of methodical experiment we entered data in your experiment book.
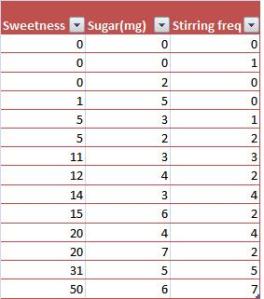
Now we run a linear regression analysis on our data to get following equation with adjusted R square value of 0.90 .
Sweetness = 1.93 sugar + 5.37 stirring freq – 6.43
Though adjusted R^2 is good enough, we create one more variable sugar*stirring freq. We run the regression model again with assumed relationship Sweetness = c1 * sugar + c2 *sugar* sf + c3 .
Eureka! we see that now we have the adjusted R^2 of 0.9966 .
Now the valid question would be, how could you have thought of adding a variable like sugar*sf ? True the choices are plenty, we could have sugar*sugar* Sf or sf*sf .
The answer lies in exploratory data analysis. It’s always very helpful and insightful to plot all the explanatory variables with dependent variable, and see how do they change with respect to each other.
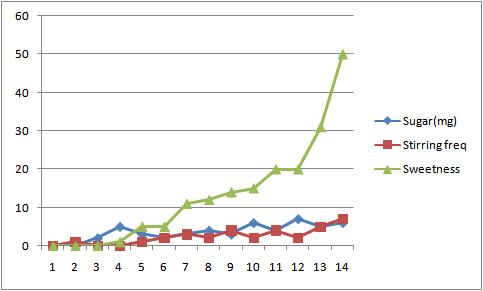
Looking at the plot above, it would not have been difficult to try the equation that we tried to get such a good result. Varibles like these are called interaction variables. Think of the experiment we just tried, it seems logical that stirring would have more effect on sweetness when sugar quantity is high and vice versa.
Though a good look or understanding of explanatory variables is best guide to create an interaction variables, but when there exists higher order interaction effects, it gets cumbersome. Automatic Interaction detector or CHAID are statistical methods that have been developed to save us from this strainful mental exercise.
A real life examples:
- Sale of Opera ticket: A statistical profile of opera ticket buyers reveal that they are both highly educated and upper income. This information can be leveraged to build a model for opera ticket buyers, but as we know all upper income segment are not highly educated; nor all highly educated belong to high income strata. In this case we would like to have a third variable that reflects the fact that a person is both highly educated and upper income. This third variable is interaction variable.
The logic of Duckworth-Lewis
No one has control over inclement weather. Neither are we good at weather forecasting!
A cricket one day match that usually takes eight hours of play, has to withstand the whims of rain and bad light. To counter it, to have a result at end while being fair to both teams has been challenge for cricket administrators. More so because, it is like forecasting the result of matches somewhere in the middle of action, and this goes against the grain of sports whose charm lies in it’s unpredictibility.
Cricket tried few methods before settling in with D/L method. Most notorious of methods is maximun-score over concept. This costed SA the berth in WC 1992 final.
- Maximum-score over concept: This method asked the second team to chase down the best overs ( in terms of runs) by first team in stipulated over. Consider the popular match, SA vs Eng, WC 1992. England scored 252/6 in 45 overs, in reply SA scored 231/6 in 42.5 overs. Rain interrupted the match, and 2 overs were reduced. Now since, out of 45 overs that England played, in best 43 overs they scored 251 runs.
Then in 1997 came D/L method, most scientific method developed by two statisticians, Duckworth and Lewis.
The essence of the D/L method is resources. The two resources are ‘overs left’ and wickets in hand. Feeding these two values, P(O,W) is calculated. The function p(o,w) has been kept confidential for commercial reasons. They have reached at this function applying statistical techniques on historial data. They keep updating it, Most recenly it was updated on 2004 to accomodate the fact the one day cricket had become high scoring compared to last decade. The p values signifies resources left.
p(50,10) = 100% p(0,10) = p(0,0) = p(48,0) = 0%
Below chart plots p values.
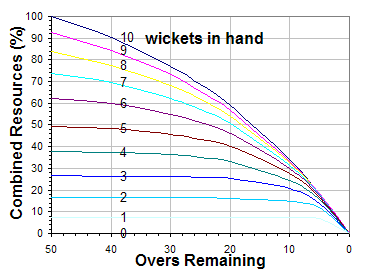
Here is it in tabular format. It’s in concise form; the complete table can be found here. 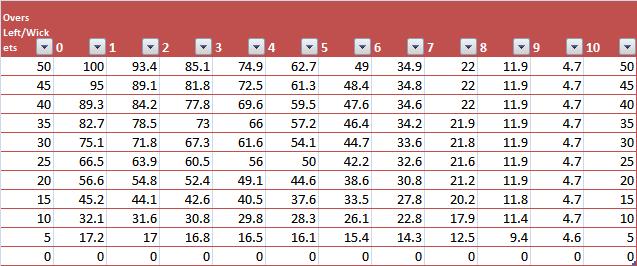
How to use the table?
Broadly, there can be three kind of possibilities.
The most simple 3 in 1 scenario would be team batting first, bats for 20 overs for 110/3, then there is an interruption, and the game is now curtailed to 30 over game. Team 1 bats for 30 overs with final score of 210/6. On reply team 2 is on 90/4 in 10 overs when the again rain plays its part. For bad light game is again curtailed to 20 over game, now what would be target for team 2.
Solution:
From above table, Team 1 on its 20th over would have left with p(30,3) resources. It’s 61.6% . Now when play resumed, team 1 had p(10,3) resources left. it ‘s 29.8% . So total resources utilized by team 1 is 100-60.6+29.8=69.2%. At lunch time the game was still of 30 overs, so resources available to team 2 is 75.1% .
So at lunch the target for team 2 would be 210+225(75.1-69.2) = 223 . The value 225 is G value. When the team batting first looses some overs, sometimes it’s favours batting side or bowling side, depending on wickets lost by batting side. For target calculation for team 2 in these situation we use
T = S*R2/R1 or S or S+G(R2-R1) for R1>R2 or R1=R2 or R1<R2 respectively. The value of G is 225.
Now back to our imaginary problem, after ten overs resources left for team 2 is p(20,4) = 44.6%, but there is a rain and they loose 10 overs more so resources left after rain 28.8%. Because of rain they loose 44.6 – 28.8 = 15.8% resources. Hence revised target would be (210+225(75.1-69.2))*(100-15.8) = 188.
There is one more method put forward by an Indian Vasudevan to set target. ICL has adopted Vasudevan’s method, and it seems to give more practical target compared to D/L. The criticism of D/L has been that it gives too much weightage to wicket, and wicket of , say Tendulkar and Ishant is given equal importance.
Export – Import
Please have a look at the graph of US GDP components. Please keep in mind that
GDP = Personal Consumtion Expenditure (PCE) + Gross Private Domestic Investment (GPI) + Government Consumtion Expenditure and gross investment (GCI) + Exports – Imports (Net exp)
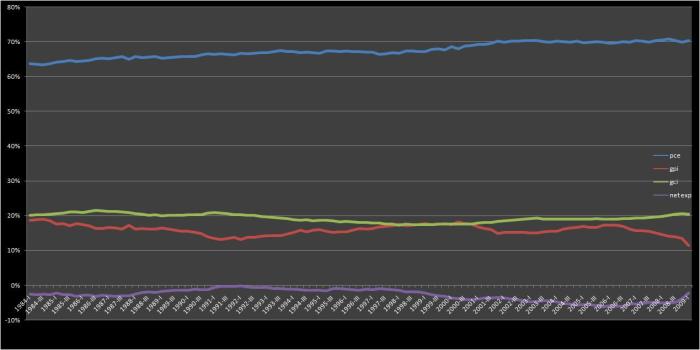
We observe that for entire period 1984 to 2009 net export for US has been negative. In fact this has been the case for last fifty years. Till last year people had started arguing that the best way to run an economy is to import and consume, and do nothing. USA the most economically strong country was doing so. Though from the data, till last year also, this shouldn’t have been concluded. From the graph we see that for last 25 years personal consumtion expenditure has hovered from 63% to above 70% of GDP, that is, it has been the major chunk of GDP.
This 7% rise in PCE is accomodated by decrease in Gross private investment and net exports. This is what economist mean when they say that fundamental of USA economy is flawed.
Will try to get similar chart for India, and would be interesting to see how do they compare against each other. For India, net export would be positive, and would be increasing. PCE won’t be this high, but it would certainly show upward trend. Gross private investment would have upward movement, and government consumtion and expenditure downward. All sign of a healthy economy 🙂 .
SBI’s Expansion Plan
SBI is in process of transforming itself from senile, laggard observer to an enterprising youth who is not afraid to try novel things to achieve unachievable dreams ( for government owned arms by their own set standard).
Year 2006, O.P.Bhat took command of SBI as the new chairman. He identified three major cancerous concerns that were keeping SBI far behind private banks. ( Source O.P.Bhat’s interview from Mckinsey Quarterly)
1: Most skillful, experienced professional of SBI were taking VRS, and they were joining private sector banks with their vast grassroot level experience. He stopped the VRS scheme.
2: SBI was not ready to serve the upwardly mobile , high earning young generation of the country. It consisted a bunch of unmotivated, directionless group of workers. He started to instill a sense of ownership in employees. Few programs were launced with successful results. Senior professional from all over India were invited for brainstroming sessions.
3: SBI were lacking in treasury operations. he realigned it’s treasury operations.
Yesterday, I saw his interview in CNBC TV18. The major points that come to mind:
1: He is looking for consolidation. ICBS, a chinese bank, is ten times larger than SBI. SBI in it’s current form is too small to serve large corporates of India. If things has to go by his pace, he would like all SBI’s ( SBI mysore, indore..) to be consolidated under one umbrella.
2: The world is getting globalised. So he would like to serve at least the indian MNC abroad also. Now SBI’s business in india compared to abroad business is 88 to 12. He would like this ratio to be 75:25. For that they might need to acquire some foreign banks.
3: Goverment is looking for divestment, they might decrese their holding to 51%.
4: Grandchildren have more freedom. All subsidiary of SBI like SBI cap, they don’t have to adhere rules like parent SBI. They hire people in market rate, and for all practical purposes work as private organization. I don’t know why and how is this the case, but that’s what I learned.
In the end, it really gives satisfaction to know that a bank that we always, since childhood, considered synonyms with banking is doing good. Logically, if we apply Bastitiats’ teachings, I am not sure would it really matter for economy, country or us, whether SBI or any private bank does well. But, nonetheless, it is a satisfying news.
Forecasting value of a Real Estate Property
“Real estate is the safest and most rewarding investment” . This idea has been thurst into our understanding like devine words. No one ever dared to question, fearing it would be sacrilegious, and would amount to utter stupidity till recent financial turmoil.
The assumtion that real estate value increases perpetually was one of the basic mistakes that led to this crisis. Now the fundamental has been jolted, there is a need and urgency to develop a model to forecast house price. How can we understand this variable with other macroeconomic parameters.
Let me digress for a while, for two paragraphs.
What do you think house price would be leading, co-incidental or lagging indicator. To me, at first thought, it should be co-incidental. Moreover, It would rarely be used as an economic indicator to forecast economy. Real estate market is so illiquid, and data points are so less that it would not be too wise to use it as independent variable. Nonetheless research has shown that there is high correlation between REIT ( Real Estate Investment Trust) index and S&P 500 stock index.
Secondly, the most basic logic in favor of perpetual increase in real estate value I hear is that population is increasing, and everyone needs a home to stay, so price of land has to increase, and so of house. There is no denying to this simplistic logic. Simple logic more often than not are the most valid logic, but here there are number of other factors.
Now coming back to forecasting real estate value. It would be better if we first go through common and current methods of valuation of real estate property.
The four common methods to value real estate:
1: Cost method: here the value is determined by replacement cost of improvements plus an estimate of the value of land. The replacement cost os relatively easy to determine using current construction cost, but valuation of land is a tricky business.
2: Sales comparison method: this method uses the price of similar property or properties from recent trsactions. Prices from other properties must be adjust for chracteristic unique to to each property and market condition. This method requires comparable sales data. If we have good data points, more comprehensive approach would be to go fo hedonic regression, where specific characteristic of properties are quantified.
3: Income method: This method as name implies uses the discounted cash flow model, that is present value of future income. NOI is net operation income from property, and so value of property is NOI/r ; where r is estimated required market rate.
4: Discount after tax cash flow model. This is variation of above model where we consider marginal tax rate of investor as well. The net present value of an property equals the present value of after tax cash flows, discounted at the investors rate of return, minus the equity portion of the inmvestment.
Now going through all the methods of valuation, it is clear that more than us choosing the method, it’s method that chooses us depending upon the context, situation and availability of data.
Forecasting real estate values won’t be an easy path. We might have to use various methods, make number of assumption. In next post will discuss few common approaches economists have adopted for it, meanwhile pleae let me know how would you tackle this problem.
NHB Residex
Few months ago CNBC TV18 alongwith Boston Analytics launched India’ first consumer confidence index. It was a pleasant news to know, and a sign of maturity of India’s business world. Now today again I am surprised to know that we have a housing price index as well that too from 2007.
The index has been prepared by National Housing Bank. In first stage they prepared index for five cities (Bangalore, Bhopal, Delhi, Kolkata and Mumbai). The base period was 2001. At present NHB residex has fifteen cities with base period 2007, now the plan to prepare index for thirty five cities having million plus population. The details can be found here.
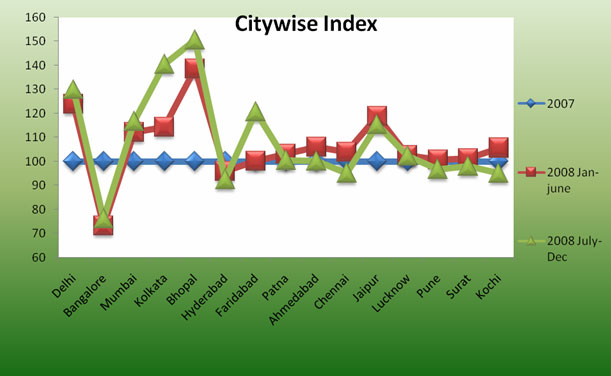
Have a look at the chart below from NHB. It seems that Bangalore has been worst hit by financial crisis.At first thought sounds intuitive. Export sector is most exposed to sub-prime crisis, and Bangalore’s vein and artery is IT and ITES sector, that does export of services. By the way within Bangalore housing prices in Lavelle Road plunged lowest in Jan-June 2008. Any explanation.
Zone C is Lavelle Road, D is Richmond Town, E is Jayanagar and Rajajinagar, F is Madiwala and Banaswadi. Any explanation on why Lavelle road turned out to be so fickle and whimsicle.
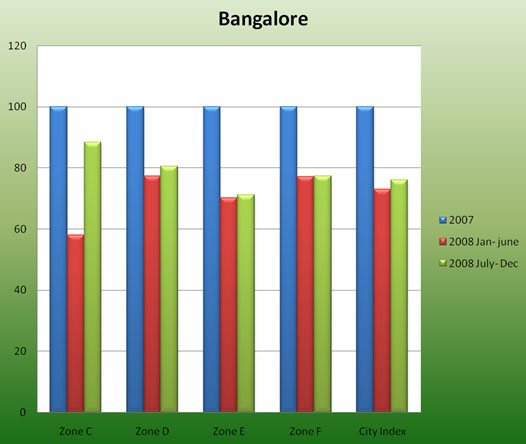
Price fluctuation within Bangalore
Will write sometime on why Housing price is one of the most important indicator of economy, and how NHB has calculated their index. As of now for methodology refer CS index.
CPI : Corruption Perceptions Index
Transparency International (TI), a civil society organization, comes out with a less famous CPI every year. Compared to the popular one ,Consumer Price Index , this CPI – Corruption Perception Index- is more subjective. While the calculation methodology of Consumer Price Index seems intuitive to even an uninitiated, the methodology for Corruption Perception Index raises few questions to an inquisitive mind.
The first observation that has to be made is that this is Corruption Perception Index. It’s a perception. So while keeping in mind that this is a perception – a subjective index – we must ask, How TI tries to make the composite index as objective as possible.
CPI, for the purpose, is defined as abuse of public office for private gain. It’s a composite index. The CPI 2008 draws on 13 different polls and surveys from 11 independent institutions. All institutions provide ranking and overall extent of corruption of countries they operate on. The definition of corruption being same as defined above, and survey excludes cases such as political instability and nationalism.
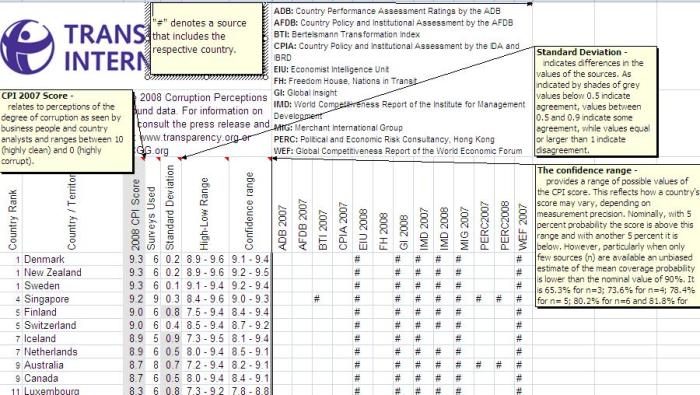
Sources of Data
TI receives score of corruption from all surveying institution. All survey result providers are not considered at par. While data compiled by African Development Bank, Asian Development Bank, CIPA are taken as it is, as they regularly analyze a country’s performance, crosschecking it with peers; the data compiled from IMD and PERC are averaged out with last year to reduce abrupt variation in scoring from random effects.
Type of questions
ADB, AFDB, CPIA by World bank ask for ineffective audits, conflict of interest, policies being manipulated by corruption on a scale of 1(bad) to 6(good) . BTI asks question such as to what extent Government can contain corruption or to what extent public is tolerant to official corruption. Likewise all surveys compiles data on extent of corruption on some scale.
Sample Design
While all sources provides data on extent of corruption, the sample design varies from institution to institution. For ADB and AFDB sample is foreigners having business experience in local country to avoid home-country-bias. IMD, PERC asks question from local residents or expatriates.
Now one may raise concern that there may be a problem of circularity, that is previous year score might affect respondent response. TI tested this hypothesis in year 2006, and it was found to be not true.
Standardization of data
